
Each year we analyse the ATO’s RDTI Transparency Report, uncovering sector trends, funding patterns, and the impact of Australia’s flagship innovation program.
Sent straight to your inbox so you always have it on hand.
KEY FINDINGS - RDTI23
Up 42% from FY22, a record year.
11% more than FY22, with 3,789 new entities.
vs 14.3% all Australian companies.
Yet public-listed firms average $6.4M.
A LOOK INSIDE
A preview of the visualisations inside the latest report.
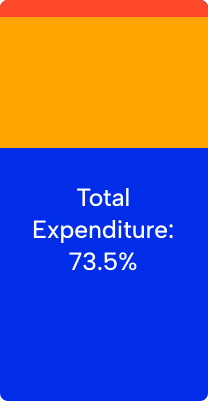
PAGE 10 - COMPANY TYPE
Most expenditure came from private companies in FY23

PAGE 13 - TOP CONTRIBUTORS
The FY23 top 10 reshuffled significantly
1
Atlassian
$220M
2
Fortescue ▲ 3
$150M
3
Cochlear
$136M
4
Manildra Group ▲ 35
$117M
5
CSL
$111M
METHODOLOGY
Backed by data from the ATO, ASIC, claimant websites, and LinkedIn, this report unpacks deep insights from over 11,500 RDTI claimants covering trends in sectors, employment, survival rates, geography, and much more.
AUTHORED BY

A former CBA lending strategist with deep expertise in capital markets and startup financing, he knows first hand what raising capital takes.

Patrick architects Kashcade's technology and the data engineering behind the annual RDTI Review, combining ATO datasets and secondary research.
An analysis of the Research & Development Tax Incentive Transparency Report data.
Published: September 2025

An analysis of the Research & Development Tax Incentive Transparency Report data.
Published: September 2024
Drop your email and we'll be in touch when it's live.
We respect your privacy and only send what matters to you.
